KIRKLAND, Wash., May 16, 2019 – Quick Serve Restaurants (QSR) face a dynamic market under constant disruption from new entrants, products and promotions. Granular, day-parted trips data can provide an analysis of changes in the market place, such as trade areas, market share, size and potential. Leveraging hundreds of millions of anonymous data points, INRIX, the global leader in connected car services and mobility analytics, evaluated the impact of recent Shake Shack openings on QSRs in the immediate area (Chick-Fil-A, McDonald’s and Wendy’s). INRIX found that Shake Shack diminished incumbent market share while increasing overall market size.
INRIX analyzed anonymized data points, also called ‘visits’, at QSR locations in Charlotte, North Carolina; Denver, Colorado; and Los Angeles, California. “Market Intelligence: Big Data Drives QSR Insights” focused on three new Shake Shack locations and neighboring QSRs to enable cross-market analysis. Using INRIX data and tools enables establishments to measure customer visits efficiently, affordably and accurately to improve market intelligence decisions.
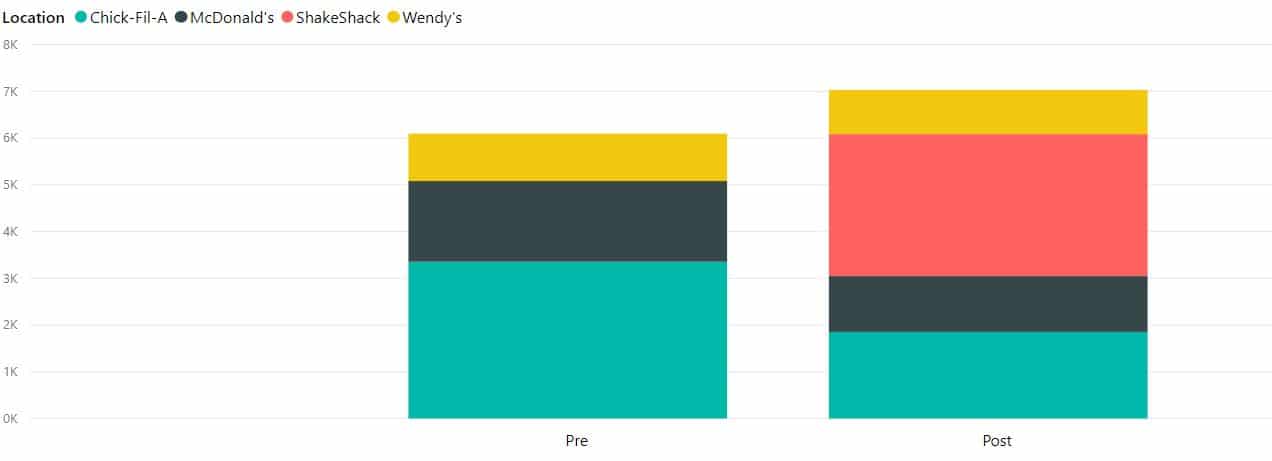
Out of the three locations studied, INRIX found the new Shake Shack in Park Road (Charlotte) was the most dynamic location due to the high number of Quick Service Restaurants in the immediate vicinity and the relative isolation of the community. The opening of the Shake Shack on April 27, 2018 corresponds with a drastic increase in overall visits to the area, but also a noticeable decline in visits to incumbent Chick-Fil-A, McDonald’s and Wendy’s restaurants (Figure 1).
Figure 1: QSR Visits
INRIX data reveals the impact of Shake Shack’s opening on market share (Figure 2). Chick-Fil-A’s market share decreased by nearly 30 percent while McDonald’s shrunk by about 11 percent. Despite an increase of visits to the area, Shake Shack attracted more customers from the incumbents than it brought to the area. Figure 3 shows that Chick-Fil-A saw their visits decline by nearly 45 percent, while McDonald’s visits declined by approximately 30 percent.
Figure 2: QSR Market Share
Figure 3: QSR Market Size
Today, hundreds of entities license INRIX market intelligence for trade areas, site selection, performance and management. Using INRIX data takes the guesswork out of analyzing market share, size and potential without the need to physically visit each location or conduct expensive studies. To review the full “Market Intelligence: Big Data Drives QSR Insights” study, please visit www2.inrix.com/qsr-study-shake-shack-2019.
###
Note to Editors:
Research Methodology
Leveraging hundreds of millions of anonymized data points, INRIX Research successively analyzed visitations to QSR locations in three markets for the month preceding and proceeding the opening of a popular franchise restaurant, Shake Shack. Anonymized data points were collected by geo-fencing the restaurants and their parking lots. A device (mobile phone or vehicle) transmitting location data that entered this defined space was counted as a ‘visit.’
Restaurant openings were limited to locations where the restaurants were standalone structures typically with separate parking from other stores or restaurants. Limiting the scope of the study to these types of locations was done to isolate customers of a given restaurant. Visit counts in this study are referred to the number of observed devices that enter the geo-fenced location throughout the observation period. However, isolating exclusively patrons of these locations was not possible, resulting in ‘false visits.’ A loitering pedestrian, a customer of a nearby store, or a construction worker working on the new Shake Shack location would result in a false visit. However, the presence of these false visits did not undermine the substantive findings of the study. The scale of visit counts and market share to the observed locations is statistically significant, identifying major market changes directly attributable to Shake Shack openings.


