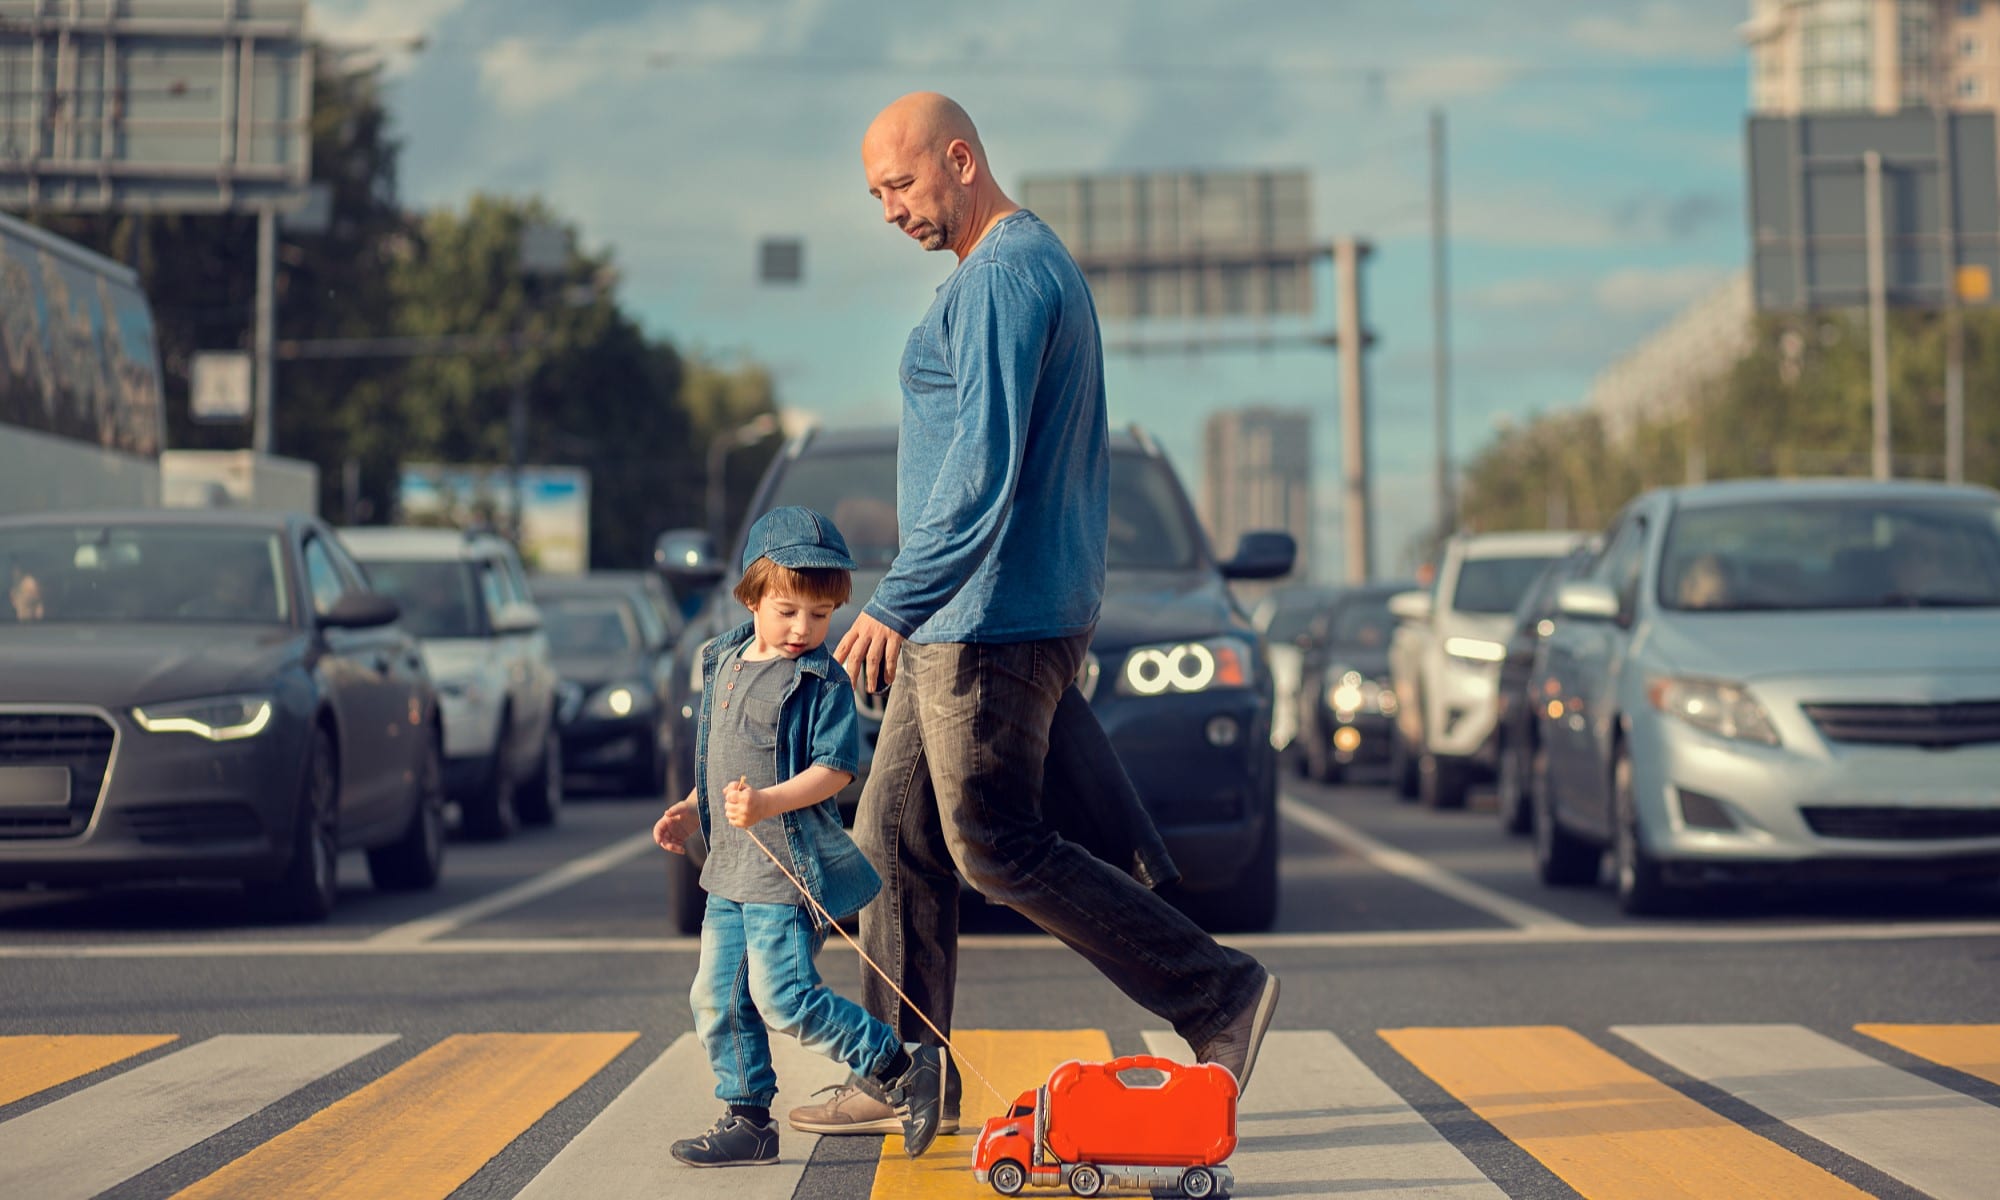
With Labor Day in the rearview mirror, we kick off another season: Back to School. Beyond school supplies, lunch meal preps and afterschool activities, parents are rightly concerned with how to get their kids to/from school safely. Their concerns are well-founded.
According to GHSA’s report published in June, pedestrian fatalities in 2023 fell 5.4% from 2022 levels. Yet, despite the decrease, pedestrian fatalities still sit more than 14% higher than pre-COVID, 2019 levels. Even though the largest increase has been during the nighttime (+23%), daytime pedestrian fatalities have continued to climb as well since 2019 (+9%).

Pedestrian safety is centered around many factors, including vehicle speeds, the weight of vehicles, reckless and impaired driving, street design, homelessness, distracted driving, lack of enforcement, and the built environment, to name a few. INRIX took a deep dive into the built environment when it released its “INRIX School Traffic Safety Study” that involved detailed analysis of the road network surrounding Washington D.C. schools.
Our analysis found that the school zone designation does help reduce fatalities and major injuries – with 13% fewer fatalities and 20% fewer major injuries occurring in school zones versus non-school zones. Collisions resulting in minor injuries were similar when adjusted for vehicle miles traveled.
We discovered signage near school zones is often confusing and conflicting, and results suggested that the built environment is a factor in speeding. Household income is also a factor – schools with a higher population of students on free and reduced lunches saw more speeding and crashes than schools with higher-income household students.
The findings should continue to inspire public officials, transportation experts, school staff and parents to bring pedestrian and cycling fatalities down. Strategies to curb excessive speeding in school zones could be to reduce traffic volumes near schools, boost enforcement where excessive speeding is occurring and creative treatments to the built environment to reduce pedestrian/vehicle conflicts.
Data-driven tools like Safety View provide insights even before serious crashes occur, leveraging the latest data points on True Near Miss Detection, demographics, and Vulnerable Road User statistics. It also allows public officials to conduct before and after studies on any project, giving decision-makers the tools they need to reduce conflicts in school zones in their area, providing context-sensitive solutions to keep kids, and others, safe.


