(SCROLL DOWN FOR INTERACTIVE MAPS)
Since COVID lockdowns began, INRIX has been covering the movement of people and goods across the United States and abroad. Prior to this latest release, we have focused primarily on the movement of personal/passenger vehicles, local fleet/delivery services, and long-haul, over-the-road trucking. Since more than 80 percent of trips in the United States are made via automobile, this is a key metric INRIX will follow moving forward. Along with our popular blog series, studies on COVID’s impact within cities, over-the-road trucking, and vehicle miles travel.
However, to better capture the impact of COVID on cities, INRIX has also developed metrics and visuals to measure activity, regardless of mode. We call this, “Re-Emergence.”
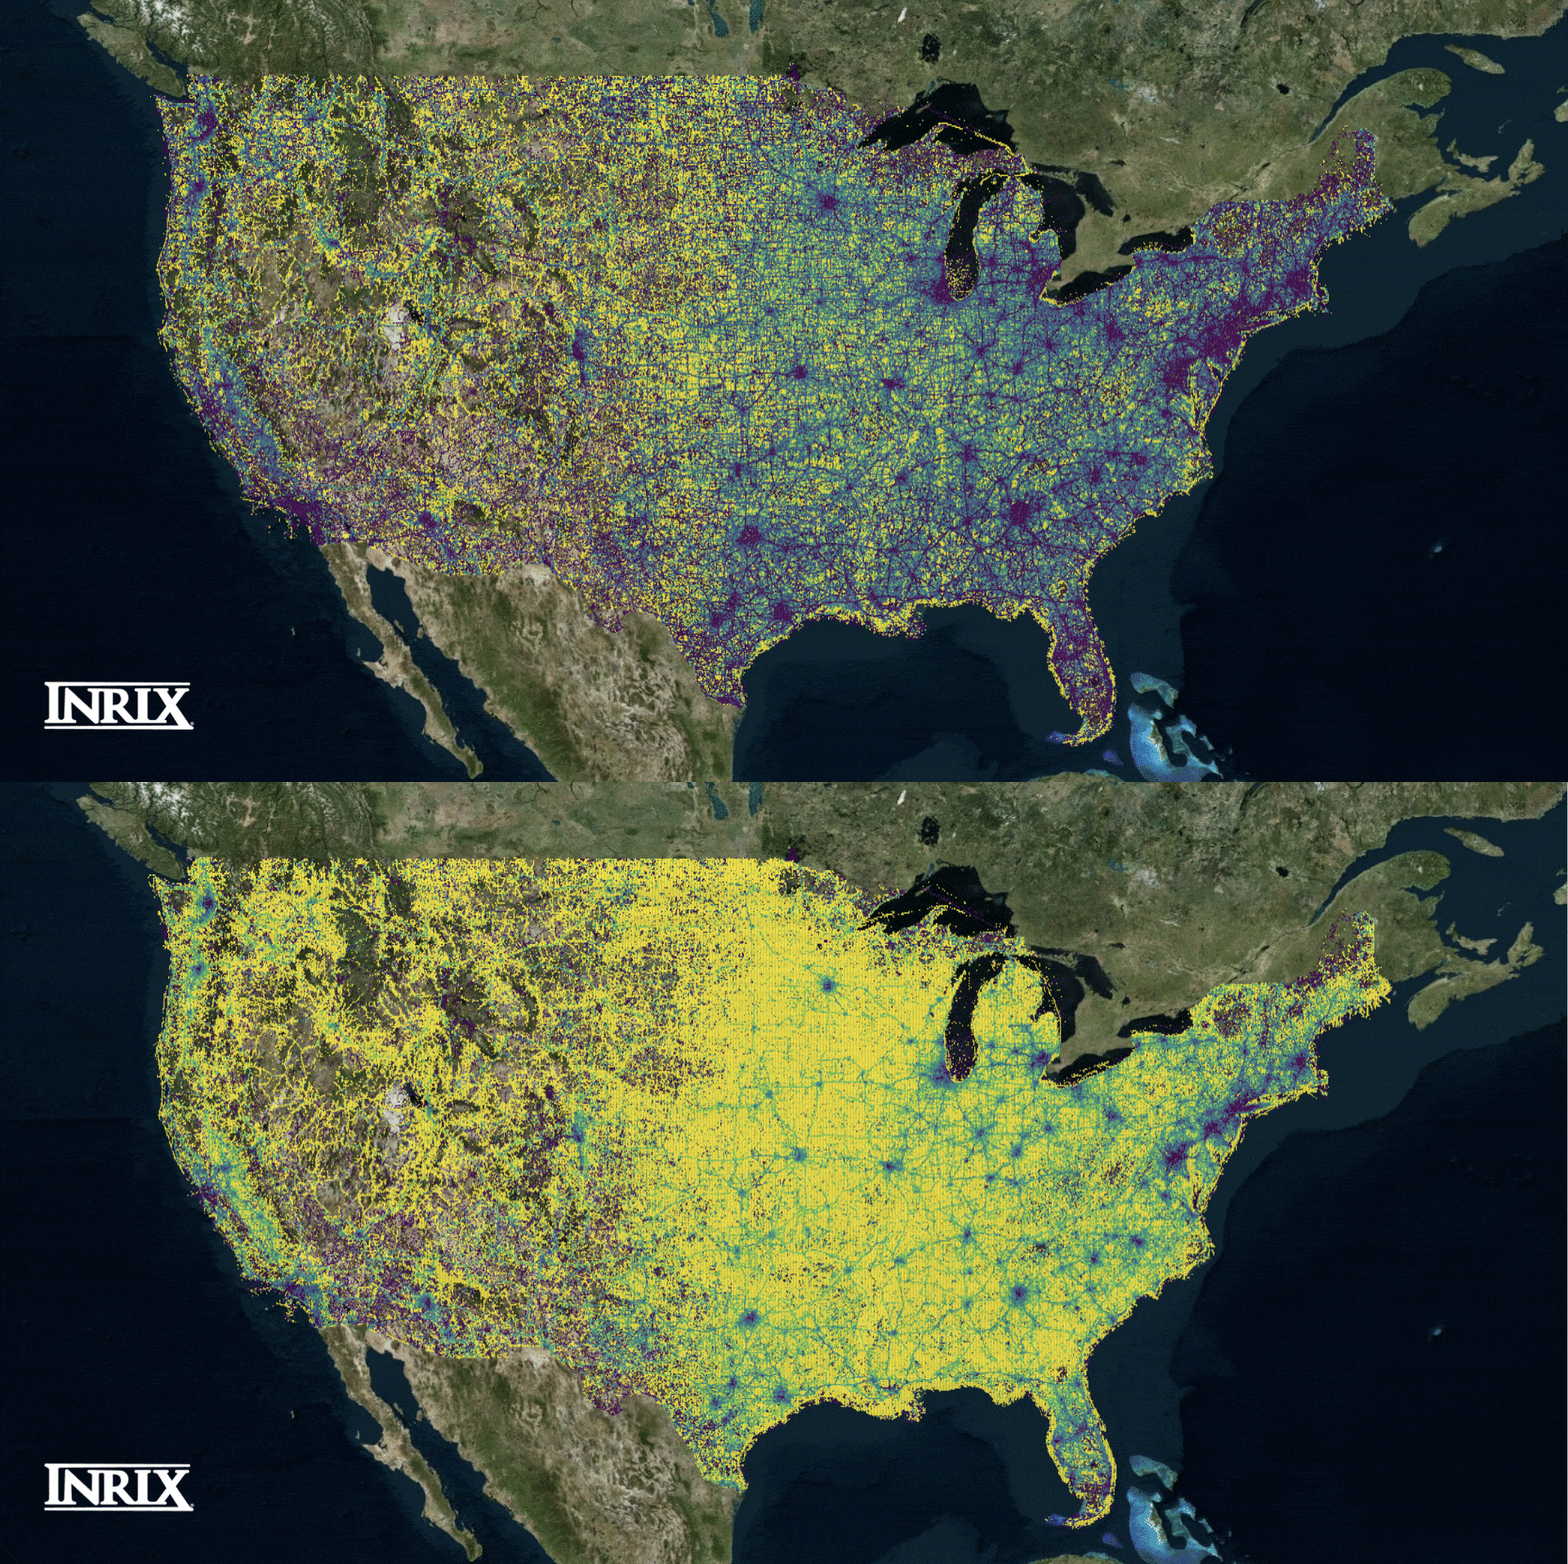
On a national level, cities across the country buckled down in response to the Coronavirus. During the weekdays during the week ending on 4/11, INRIX compared activity across the country to February, pre-COVID levels. In general, the first and second weeks saw the lowest amount of travel since COVID-related shutdowns began.
As we can see, especially in cities proper, activity decreased versus the February baseline. Cities like Seattle, San Francisco and Los Angeles on the West Coast saw large decreases in activity. In the Midwest and South, Chicago, Detroit, Dallas and Atlanta saw limited activity in the wake of the Coronavirus. And with COVID continuing to focus on New York Cities and the Northeast, activity up and down the coast has remained low.
However, the country as picked up steam. Movement around most of the country has increased from the February baseline and the April 11 update – in our May 13, 2020 release.
[s201_bai id=”3″]
While shutdowns from COVID are still leaving many central business districts and surrounding areas pretty dormant, suburbs and exurbs are coming back.
Drilling down further, on the city level, gives us more insight. For example, we see beaches in Seattle and Los Angeles are coming back. Activity in Houston’s suburbs has picked up but has left the Downtown area dormant. New York City and D.C. hasn’t seen much of an activity rebound, though pockets of Tysons Corner and other surrounding areas have seen a slit uptick in activity. Below are two maps utilizing INRIX data: One for the five weekdays prior to April 11, and the other of the five weekdays prior to 5/13. Dark purple indicates a reduction of activity, while bright yellow indicates increased activity – compared to pre-COVID levels.
Subscribe to our blog and check back next week – even more cities and Memorial Day traffic and activity!
New York:
[s201_bai id=”4″]
Washington DC:
[s201_bai id=”5″]
Seattle:
[s201_bai id=”6″]
Los Angeles:
[s201_bai id=”7″]
Houston:
[s201_bai id=”8″]


